|
Alternative Models 4
|
|
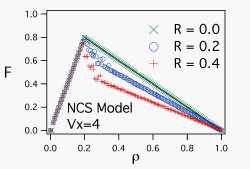
The main difference between this and previous results of Nagel-Schreckenber model is in their behavior around the critical density . It appears as though there is the third phase characterized by steep decline of F(\rho) in between the free traffic phase at low \rho and the jamming phases high \rho. |
 |
|
F \to U . \rho
|
(5.4)
|
and for the large density side, \rho \to 1, it is
|
F \to (1-R)(1-\rho)
|
(5.5)
|
which are both unchanged from the standard model.
What is going on at the intermediate region around the critical density \rho^* ? The answer is in the term "over heating" which sometimes occur for the phase transition of matters. Further numerical experiments will reveal that the witdth of this apparent third phase depends on the size of the road L. In this example, it is taken to be L = 200. With L = 1000, for example, the width in the region of steep F decine becomes far smaller. At the limit L \to \infty, the free phase and the jamming phase meet at the critical density \rho^* with discontinuity of F, which is a characteristic phenomena of overheating.
We however shall postpone the pondering on the difficult subject of the order of phase trasition, and examin the content of the flow around this region by looking at the flow diagram.