|
Alternative Models 5
|
 \rho=0.15 |
 \rho=0.25 |
||
 \rho=0.50 |
 \rho=0.75 |
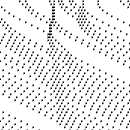
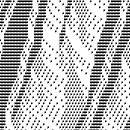
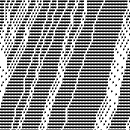
In a casual inspection, they look rather similar to the previous examples with the standard model. However, closer examination of the flows at intermediate densities, \rho = 0.25 and \rho = 0.50 reveals the appearence of jamming block with lighter color compared to the one with familiar darker color.
In the darker block, cars are packed next to each other (in inter-car distance one) and they will not move until the edge of the block comes to them after which they can start to move. In the lighter jamming block, the cars are aligned with one empty bock in between each other (in inter-car distance two), and cars proceed one cell at each step. Therefore the lighter one can be termed slow-moving jamming block compared to the darker absolute jamming block.
As all drivers know, real-life traffic flow, such slow traffic jams are at least as frequent as the absolute sort, and are no less frustrating. In hindsight, the lack of such partial jam in the standard model has to be counted as it limitation coming from its simple construction.